How I automate vessel tracking to determine the last date a vessel sailed from a country.
One of my favourite project types is integrating various data sources into one result set, especially when using external data with a well-known data set. It excites me to see how complementary data sets can enhance the value and data quality. This post explains how I integrated Marine Traffic—a leading vessel tracking application, with export information. The objective was to gain visibility into the final vessel departure dates from South African harbours. It is crucial for exporters to know when a vessel is finally en route to export markets. It is also essential to have an automated quality check for industry-level statistics, summarising exports weekly.
In this blog post, I explain why Google Sheets is a great tool to use with Python and SQL. Google Sheets is a user input form, while Python and SQL are used for data storing and processing. To illustrate the power of this combination, I allude to a recent project I completed for a client. Budgeting is a unique process for everyone, and the contents of a project like this will vary depending on the specific application. This post focuses on the technical aspects of the project, rather than the specific use case.
Problem statement
Some vessels visit multiple ports in a country during the same journey. I evaluated 380 container vessels departing South African shores over six months (11 May 2023 to 1 November 2023). In total, 194 (51%) visited only one South African load port; the rest visited more than one port. The time a vessel spends in South African waters varies significantly and depends on the cargo, port congestion, and shipping line. Rapid turnaround is needed to maintain quality produce and a strong import and export market.
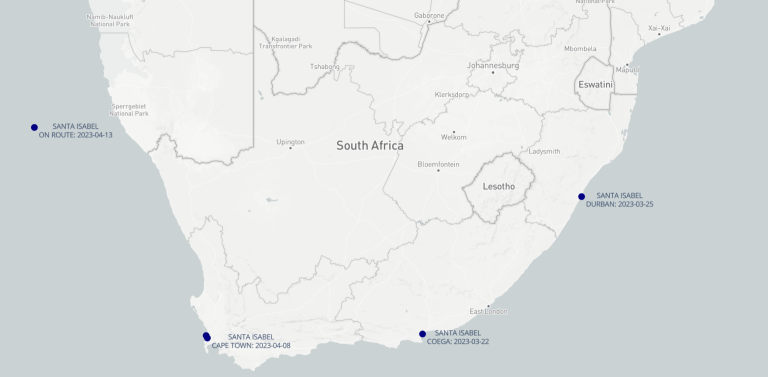
To illustrate, we use one vessel journey. A journey begins when a vessel departs from a load port and ends at the final discharge port for cargo originating from the load port. Figure 1 demonstrates a journey by Santa Isabel (IMO number 9444728) from 25 March 2023 to 13 April 2023. The Santa Isabel is a large container vessel, transporting goods between South Africa and Europe. She arrived at Coega (ZAZBA) on 22 March, followed by a visit to Durban (ZADUR) three days later. Both port visits were in week 12 of 2023. She next visited Cape Town (ZACPT) and remained in anchorage from 31 March to 13 April (weeks 14 to 15). She spent more than three weeks in South Africa. As a result, the export data showed three ‘sail dates’ for the same journey.
Deriving one vessel journey at a time is straightforward, but the problem becomes more complex when evaluating a fleet of 80 dynamically changing vessels. The following section summarises the solution to this problem.
To illustrate, we use one vessel journey. A journey begins when a vessel departs from a load port and ends at the final discharge port for cargo originating from the load port. Figure 1 demonstrates a journey by Santa Isabel (IMO number 9444728) from 25 March 2023 to 13 April 2023. The Santa Isabel is a large container vessel, transporting goods between South Africa and Europe. She arrived at Coega (ZAZBA) on 22 March, followed by a visit to Durban (ZADUR) three days later. Both port visits were in week 12 of 2023. She next visited Cape Town (ZACPT) and remained in anchorage from 31 March to 13 April (weeks 14 to 15). She spent more than three weeks in South Africa. As a result, the export data showed three ‘sail dates’ for the same journey.
Solution
To solve this problem, I used the well-documented Marine Traffic Application Programming Interface (API) service. The single vessel position endpoint (PS07) allows the tracking of vessels in real-time using terrestrial and satellite tracking. Since this project only needed to know if a vessel departed South Africa, the terrestrial tracking seemed sufficient.
A list of active vessels—vessels under inspection, is created daily from fundamental data. Each vessel is queried, and the position is stored in the database. After saving the vessel entry for the day, a check is run on the latest status of that vessel to see if the position is within a predefined geofence. A geofence is a virtual perimeter drawn with coordinates. Figure 2 illustrates the geofence boundaries I defined. This shape was drawn on Google Earth, and the GPX file was exported. The GPX file is stored in the source code and parsed when evaluating if a vessel is inside or outside of this shape. If a vessel geolocation falls inside the shape, it is marked as ‘in South African waters’. If a vessel is on the active vessel list and its geolocation is outside this shape, it is on route or travelling from South Africa.
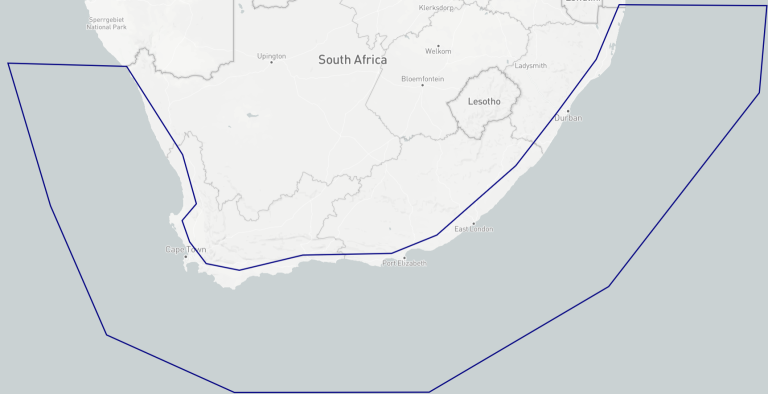
I used a Python package called shapely to verify if a point is inside an odd-shaped geofence, such as the one in Figure 2. First, a geographical point (“Point”) is registered, and then the list of latitude and longitude points for the shape is passed to check against. The “within” function returns a True—yes, the point is inside the boundaries, or a False—no, the point is not inside the boundaries.
					def check_point(self, point, coords):
     # Register a Shapely Point
     p = Point(point)

     # Create RSA Coastline Bounds
     # Coords is a list of latitude and longitude points
     poly = Polygon(coords)

     # Return True/False
     return p.within(poly)
Before implementing this method, I used the “next destination field” in the return data from Marine Traffic to determine if the vessel was on route. This caused concerns about data quality as a vessel could change direction and return to a South African port without sailing far. After implementing this method, the status of a vessel only changed once it was outside the border provided by the geofence. Without the technique described in this post, the vessel would register a new journey instead of following the same journey to the destination if the vessel schedule changed unexpectedly.
Implementation
The implementation is nuanced by the structure and nature of the fundamental data. To keep this post purely focused on using geolocation data to supplement an existing data set, I omit the additional data manipulation specific to each implementation.
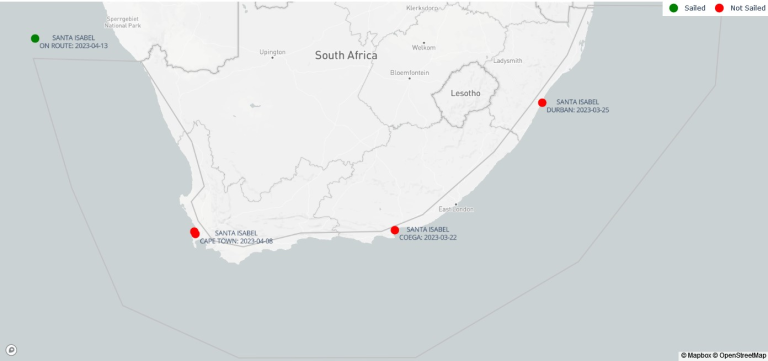
Figure 3 demonstrates the implemented method. The red markers display that the vessel has not yet departed and is part of the same journey. Once the vessel sails outside the boundary, it is marked as ‘Sailed’ and takes the sailing week off the last sail date.
Tips and considerations
Table 1 demonstrates the result for the Santa Isabel visit from 25 March 2023 to 13 April 2023. Data in the resulting reports were supplemented with the “Final Sail Date” column. On the report, users could therefore, see the dates the Santa Isabel departed from the respective load ports and the date she finally set sail on her way to Rotterdam (Netherlands).
Table 1: Improved data quality
| Port | Sail date | Week | Final sail date |
| Coega | 22-Mar-23 | 12 | 13-Apr-23 |
| Durban | 25-Mar-23 | 12 | 13-Apr-23 |
| Cape Town anchorage | 08-Apr-23 | 14 | 13-Apr-23 |
| Cape Town | 13-Apr-23 | 15 | 13-Apr-23 |
The data management for the project was conducted in a hosted SQL environment. All database manipulations were performed through SQL code embedded in a Python package. The Marine Traffic API was called and interpreted through Python ‘requests’—a popular package to send HTTP requests. The visuals in this post were created with Plotly Dash, a Python graphing utility leveraging Javascript visualisations. For a “live” web-app demo of this project, follow the link: https://sumitins-blog002.azurewebsites.net/
I conclude a few thoughts should you embark on a similar journey:
- Ensure vessel journeys are tracked and have an ID for each visit. Vessels can visit multiple times of the year, sometimes with a limited time between visits. Creating a counter for every visit can be useful.
- This methodology can predict the estimated arrival time for the main shipping lines. If you have an adequate history of a vessel route, the time between distances can help guide a model concerning delays for a segment of a route, etc.
- Several vessel tracking services are available on the market. I used Marine Traffic, attributable to its ease of access through its API service. It is worth exploring other providers and comparing their pricing.
Testing and quality assurance need to be defined upfront. Working with a ‘moving’ data set, such as this limits the ability to catch and correct data errors. Ensure unit tests are implemented before “go-live”.
Conclusions
Web application data, such as API, can automate workflow and enrich a data set. Most data sets available through APIs will charge the user a fee to access and use the data, similar to a web frontend portal. Consumers should know that APIs exist and that they can streamline manual processes that analysts perform—such as checking vessel schedules. Repetitive manual tasks, such as the one explained in this article, can be encoded by applying the business logic to a data processing language, such as Python or Julia.
Last, Python is an immensely powerful data manipulation and visualisation language. It is effortless to learn with endless resources in print and online. The number of applications is limitless. In this article alone, we used Python to retrieve data from an external source, manipulate the data structures, integrate with a database, visualise the data and lastly, host a web-app. One of the best things about Python is that it is free to use and has a fantastic community that is enthusiastic and dedicated to spreading the language application far and wide.