How do I structure a large dataset comparison project to illustrate transactional differences?
Electronic systems, such as enterprise resource planning (ERP), capture data generated in business processes. There is often more than one system measuring the same but slightly varied facts about a process. Transactional systems provide us with a perspective of the business process at a specific point.
Recently, I have been involved in several projects requiring comparing multiple systems at various stages of their respective processes. In one such project, I compared two financial systems. The first system captured detailed pallet-level information, whereas the other system captured financial transactions only, such as invoices. Although both approaches should have produced similar results, the automated data transaction between the systems was faulty. As a result, the client needed to know the cause of the issue and how to resolve it.
In another example, I compared transactions at various process stages, such as before stock is palletised and after stock has been dispatched from warehouses. The datasets for this project represented multiple supply chain nodes, resulting in a large dataset with several areas of divergence.
In this post, I outline the steps I use to help my clients uncover differences among datasets.
My process for data discovery projects
When embarking on a new project, especially one that involves unfamiliar data sources, several questions need to be answered. Some of these questions may be known, while others may not even exist. Comparative analysis can be challenging. As in research, you may not have all the answers, but the solution is somewhere in the process and will be uncovered if the process is followed systematically.
The cross-industry standard process for data mining (CRISP-DM) supplies an iterative and structured way to proceed. It allows the analyst to communicate with project sponsors by engaging them. More details on this process can be found in Empower decision-makers with fit-for-purpose information!. Before proceeding to the steps in the CRISP-DM model, I would like to emphasise three foundational principles that have been effective for me in these projects:
- Neutrality: A neutral SQL-like environment allows combining data from any data source in dimensional tabular modelling. It also provides an environment which the analyst has complete control over—as opposed to a system database with user and operational restrictions.
- Reproducibility: Data changes constantly, especially if you need to compare data on a “live” transactional system. Staging data in a neutral environment creates a lag in data relevance. While this comparison is useful, it may raise questions for the project sponsor. It is crucial to ensure that your data are easy to load and reload if needed. I will elaborate on this in the “data preparation” section.
- Iterative: ‘You don’t know what you don’t know when you start’. You will uncover several new facts, which is part of the process. The key is to document, solidify, and continue comparing in an iterative process. The CRISP-DM allows for iteration.
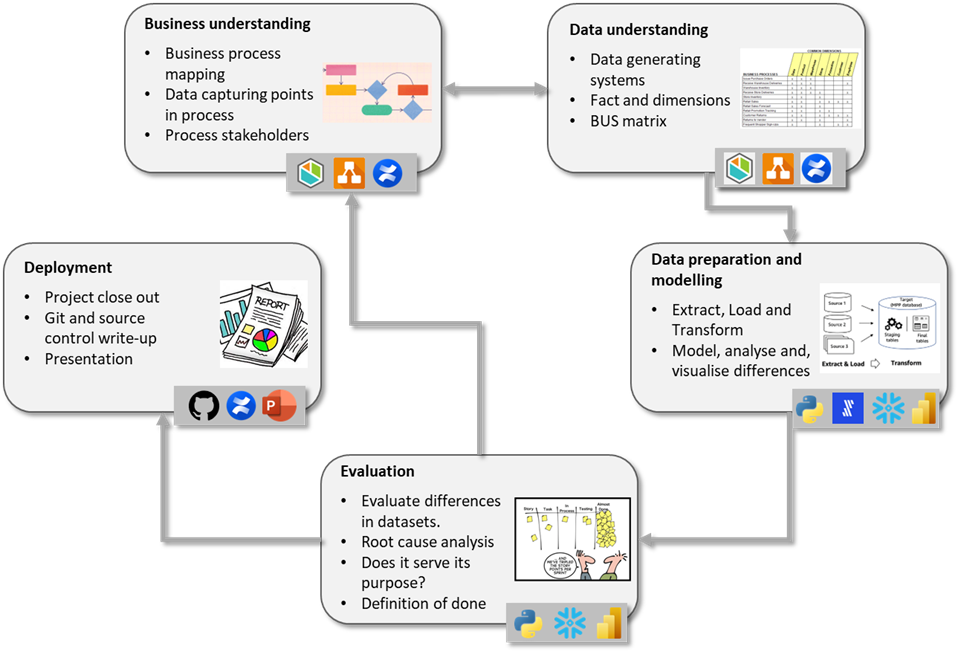
Following, I will outline the steps of the CRISP-DM model and explain how it can be applied to projects that involve comparing two or more transactional systems. Figure 2 summarises the CRISP-DM steps presented.
Business understanding
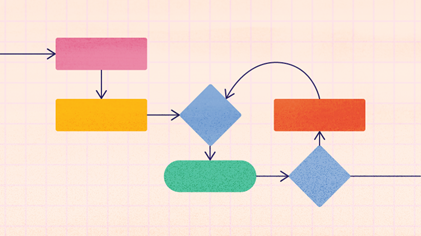
Business understanding entails understanding the business process that each system you are evaluating captures. Understanding the data entry process and the associated rules is crucial; for example, does a human enter data, or is it auto-generated through technology? What facts does the system capture about the business operations, for example, a financial system capturing invoices versus an inventory system capturing stock levels? A business understanding leads to data understanding. Plotting the business process through business process modelling can help if you are new to the process.
Data understanding
Data understanding builds on business understanding. Data understanding is one of my favourite parts of a project; it is exploratory, and you function as a detective. It entails discovering innovative data sources, tables, and often novel ways of connecting to a dataset. I usually start by using the earlier step to obtain a sense of the tables or fields needed for the analysis. This clarifies what the data measure (the facts). Mostly, clients can point to the business process or the system’s front end that captures data to identify which tables and fields are required.
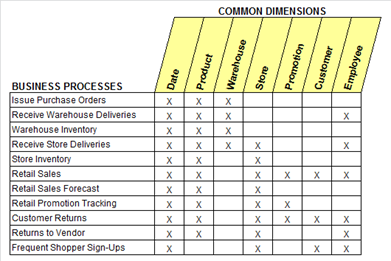
Next, I identify all the dimension fields describing a data set. The dimensions are fields used to filter or group data. A BUS matrix[1] is a valuable framework for comparing business processes with the data set dimensions. Figure 4 presents an example of a BUS matrix.
In this stage, you should convert your datasets into a format that facilitates easy comparison. It can be highly engaging but requires a combination of experience and creativity. You might experience the urge to shortcut this step by not transforming data in the database but choosing manipulations in DAX or SQL views. I find it valuable to invest a significant amount of time in the data preparation phase and adhere to the principle of neutrality by staging and modelling data in an SQL-like environment. Since data preparation and modelling are interdependent, I will discuss them concurrently in this section.
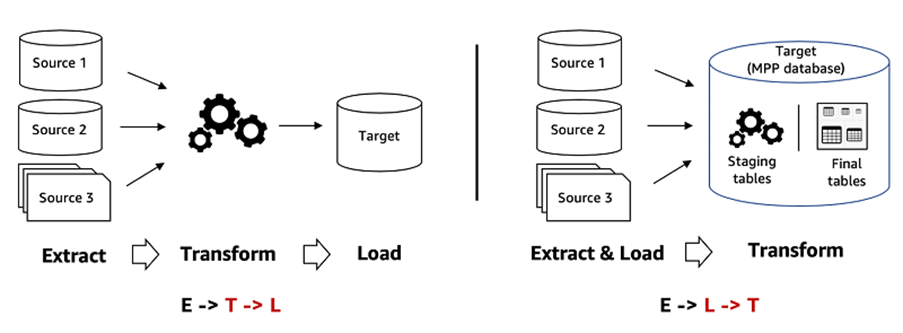
Data preparation is the foundation for any data-related project. ELT, or extract, load, and transform, is a process that involves retrieving data from source systems, transferring it to a neutral environment, and converting it into a new format that is more convenient for comparison and analysis.
Since extraction can vary depending on the data source, it is essential not to perform transformations on the raw extracted data. This ensures the traceability of steps and is especially crucial to avoid any accidental dataset differences that may arise during the extract and load processes. Once the raw data have been loaded, you can filter, fill blanks, rename, and merge new values (transformation).
Three main strategies exist for extracting raw data from source systems:
- Change data capture (or binary logs) captures each change to a data set. The source system issues a notification that the fundamental data have changed and saves a command for how it was changed. In MySQL, the process is conducted through the BINLOG, while in MS SQL, it is accomplished through the transactional log.
- Incremental extraction identifies changed records. The extracting procedure can then load only the changed records and propagate those changes to the transformed data. A shortcoming of this strategy is that it is challenging to identify deleted records. A simple solution is to add an active or inactive flag to the source data—provided you have the ability to influence the source data.
- Last, there is complete extraction. The previous two options may not be viable choices. The only solution is to reload the full table every time. This might be resource-intensive on a transactional system. It is essential to exercise caution when performing a full data refresh and when deciding how frequently to update your data.
Data transformation is the process of manipulating data into a new structure that simplifies comparison. Ideally, all the fact tables in the comparison should look the same. This means they should have the same column structure, and values should adhere to the same format (e.g. capitals, spelling, and codes). During transformation, values can be replaced in columns to match a dimension format (e.g. capitalisation or find and replace), data granularity (e.g. through aggregation functions) or calculated columns. The result of the transformation phase is to have near-identically looking fact tables that can be compared.
William Edwards Demming famously advocated that quality is a part of each step of the process. Always refer to the source dataset when analysing transformed data to ensure that the data in the analysis is still accurate.
An ELT process (as opposed to the more traditional ETL – Extract Transform and Load – process) allows for easy traceability of transformation concerns. If data transformation occurs before loading, it can be challenging to identify which transformation action is responsible for data quality errors. After data are transformed into a new format, it should be verified again with the source data to ensure that the values of the fact tables match those in the transactional system. Creating a business intelligence “view” allowing comparison of the before and after transformation of the tables can provide business users and project sponsors with clarity on where the source data originated and whether the transformations affected the values. Loaded data should always be traceable to the original data to ensure no data quality issues affect the analysis result.
Data modelling is the process of creating a visual representation of the transformed data. It uses abstraction to represent the nature of relationships in data. When comparing transactions, simple value-based or percentage difference figures are often used. The choice of measure depends on the goal of the analysis. In each comparison, identify the dimension you wish to compare based on the record’s unique identifier. Business Intelligence software, such as Microsoft Power BI or Microsoft Excel, allows for ‘slicing and dicing’ data. Measures calculate differences among datasets through DAX functions.
If you need to detect patterns or anomalies, you can use advanced analysis techniques, such as outlier detection, time-series analysis, or machine learning algorithms. The student t-test or ANOVA are useful statistical models for determining value differences by category. For instance, if you want to assess packaging weight for a specific product class between two weighing instruments, these models can be applied.
Evaluation
During the evaluation phase, the analyst can identify the root causes of errors identified in the previous step. For instance, in a recent project, the root cause of the issue was traced to the use of diverse measurement instruments. One dataset owner used the measured weight of a pallet, whereas another used the associated weight of the cartons on the pallet. This resulted in a significant difference between the two datasets (greater than 5%). Even after adjusting each dataset to use the same measurement instrument, there were still differences, but they were much more minor and could be attributed to missing values. The investigation then shifted its focus to finding the missing values.

Evaluation is a crucial step that allows the analyst to take a step back from the analysis and determine if the analysis is complete. To ensure that the project reaches maturity from a consulting perspective, I try to define a ‘definition of done’ with the project sponsor before the project starts. An example of a ‘definition of done’ could be no more than a 1% difference between the datasets. If further analysis is required, you can always scope another project based on the first deliverable. A recent post by Chris Perry suggests that data are insatiable, indicating that “there is no data point that is considered final and satisfactory”. Without a “definition of done”, the CRISP-DM cycle can continue forever. Agreeing on a definition of ‘done’ will allow for scoping another project phase or re-contracting.
Deployment
After the analyst and project sponsor agree that the analysis has reached maturity, finalise all documentation to complete the project. It is recommended to create a project close-out report that documents the extraction and transformation steps. The project sponsor may also request a final stakeholder meeting, which provides feedback to those most intricately involved in each reviewed system. I prefer to keep stakeholders engaged throughout the project since they help with the business and data understanding.
Performing general housekeeping tasks, such as saving code to a Git repository with a corresponding ‘readme’ file, can be helpful for the next analyst or if you must return to the project later.
The applications I use for comparing datasets
In this post, I focused on my preferred methods when working on data source comparison projects. The choice of applications for a project depends on the analyst’s skill and comfort level. Table 1 summarises the applications that can be used in each phase of the CRISP-DM cycle.
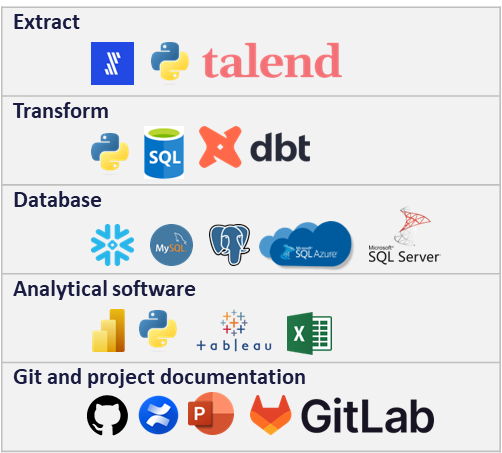
The table does not prescribe the applications you ‘should’ or ‘should not’ use. Its focus is to provide analysts with a framework to work with. Analysts should use the applications they are comfortable with and fit into the project budget. Cloud-based technologies, such as Snowflake and Fivetran, can assist with the transferability of a project if longevity is required. While I am comfortable using Python and SQL, pure Python and SQL projects can be much more complex to maintain for new analysts reviewing former codes; therefore, I have started migrating my skill set to a modern data stack that also uses embedded Python and SQL (e.g., Snowflake). These cloud-based technologies offer several elegant solutions that help structure analytics projects and enable easier access to maintenance and documentation.
Conclusion
Comparing two or more datasets is a process that requires a logical and iterative approach. It is important to note that you may not have all the answers at the beginning of the project; however, following a structured methodology like CRISP-DM can help guide the outcome and manage stakeholder expectations. In this post, I have shared the process, methods, and tools I would use. Several alternatives to this structure exist. The detailed implementation may vary depending on the project. Analysts will rely more on their experience working with data than theoretical knowledge for these projects. I find it to be a great learning experience to get to know a new dataset or team. I have also acquired several novel technical skills in these projects, especially in principles for dimensional modelling.
I am always interested in hearing from people who share my passion for this topic or have a related project. If you want to converse more about the concept I explained in this post, feel free to contact me. I am looking forward to hearing from you and exchanging ideas.